The project LitViz focuses on the question "How to visualize text information" in a well-arranged and comprehensible way.
On this website we introduce a way of visualising text-information by a 3D-graph. The algorithm uses multiple techniques from NLP (Natural Language Processing) like Stanford PoS-Tagger, Lemmatizer, Tokenizer and more to generate the necessary dataset for the 3D-function.
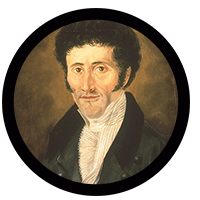
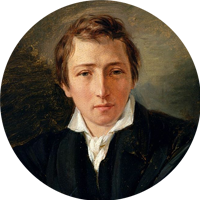
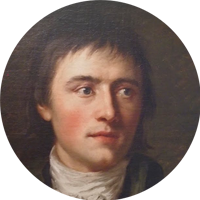
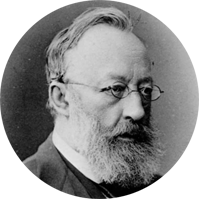
On the start-page you will find a selection of texts from different German authors and their visualizations. If you want to compare visualisations of different texts, use the subpage Compare. You can insert your own text or any other text resource, which you can visualize on the subpage Custom.